Classical statistics
Classic statistical techniques (descriptive, correlational and inferential) have been widely used in the educational field to extract valuable information from databases. These techniques help us to organise and summarise information in order to facilitate the drawing of useful conclusions about the educational environment. The databases used, however, were usually of a manageable size in terms of numbers of subjects and variables.
With the arrival of the digital society, greater amounts of information began to be managed. Large-scale assessmentsusing volumes of information that would have been excessive for previous techniques became widespread. Classic statistics is less effective at identifying patterns when the data is large-scale, resulting in it not being flexible or informative.
Data mining: Decision trees
Data mining consists of techniques designed specifically to identify patterns in massive volumes of data. And decision trees, one of the most widespread data mining techniques, seek to predict or explain where the scores of the subjects of a sample will be located in a variable (known as a criterion variable) based on knowledge of the scores obtained in a set of explanatory or predictive variables.
Decision trees can, therefore, be valuable in the study of school effectiveness when we have databases with thousands of subjects and explanatory variables (as occurs in the PISA assessment). In practice, selection of the criterion variable is based on the teacher, management team or pupil’s belonging to a school with high or low effectiveness, and selection of predictor variables on other process factors likely to be associated with effectiveness. The tree selects the variables that best differentiate between high and low effectiveness subjects, that is to say, the factors associated with effectiveness. By way of example, the following diagram shows an imaginary decision tree for a sample of pupils.
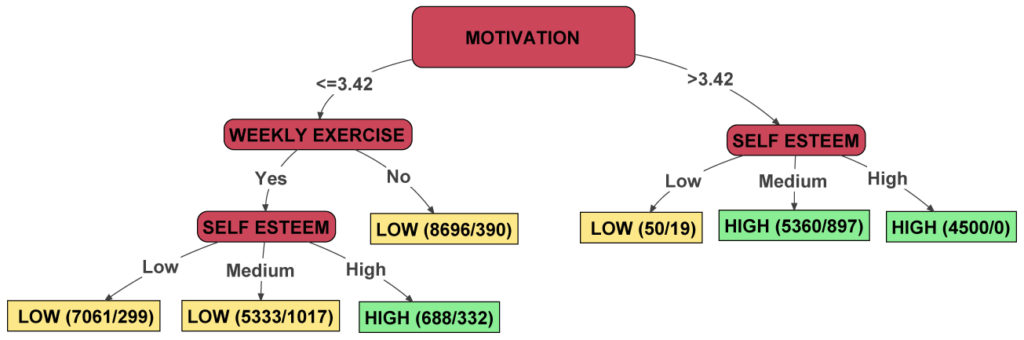
The tree features a number of branches that lead down to the leaves (rectangles) at the bottom. The rounded maroon rectangles are equivalent to explanatory variables, the branches below them indicate the possible scores of the subjects in the previous variable and each leaf shows in which type of school the pupil who belongs to that group is most likely to be. These leaves contain two numbers: the first refers to the total number of pupils who obtained the scores indicated in the explanatory variables and the second the number of pupils who do not belong to the type of school indicated (from among all of the previous ones).
In the example, there are 50 pupils with low self-esteem and a level of motivation higher than 3.42 points. If a subject obtains these scores, it is more likely for him to belong to a school with low effectiveness. 19 of these 50 pupils, however, do not actually belong to schools with low effectiveness, which is 38% of the total (19/50*100). This prediction, therefore, has an accuracy of 62%.
The 4,500 pupils with motivation higher than 3.42 and high self-esteem belong to schools with high effectiveness, so this prediction has 100% accuracy. This means that the pupils in the population with high motivation and self-esteem are clearly associated with high effectiveness. The lowest motivations appear to be more clearly associated with low effectiveness, even in the case of pupils with average self-esteem who perform weekly exercise.
Based on this tree, we could therefore conclude the following:
- The motivation variable is clearly associated with school effectiveness. High motivation levels are associated with high effectiveness.
- With high levels of motivation, low self-esteem is a risk factor for school effectiveness.
- With low levels of motivation, weekly exercise and high self-esteem can protect school effectiveness, although the level of association is slight in this case.
Comments (0)